In 2003 Barrett Gibson Lyon created the Opte Project, an internet mapping project that uses virtual graphics and open source software to provide an accurate map of the internet.
It all began when the internet entrepreneur was finishing his studies at California State University in Sacramento while also working as a penetration tester. Which, in essence, is an ethical hacker that helps businesses identify and resolve vulnerabilities that affect their digital security. And the formula he came up with at work put the basis of the network mapping visualization that is the Opte Project.
The Electric Eye – The Opte Project
BARRETT LYON/THE OPTE PROJECT
“That formula ended up being an easy piece of software to write, so I just started having this software do all the work for me,” state Lyon.
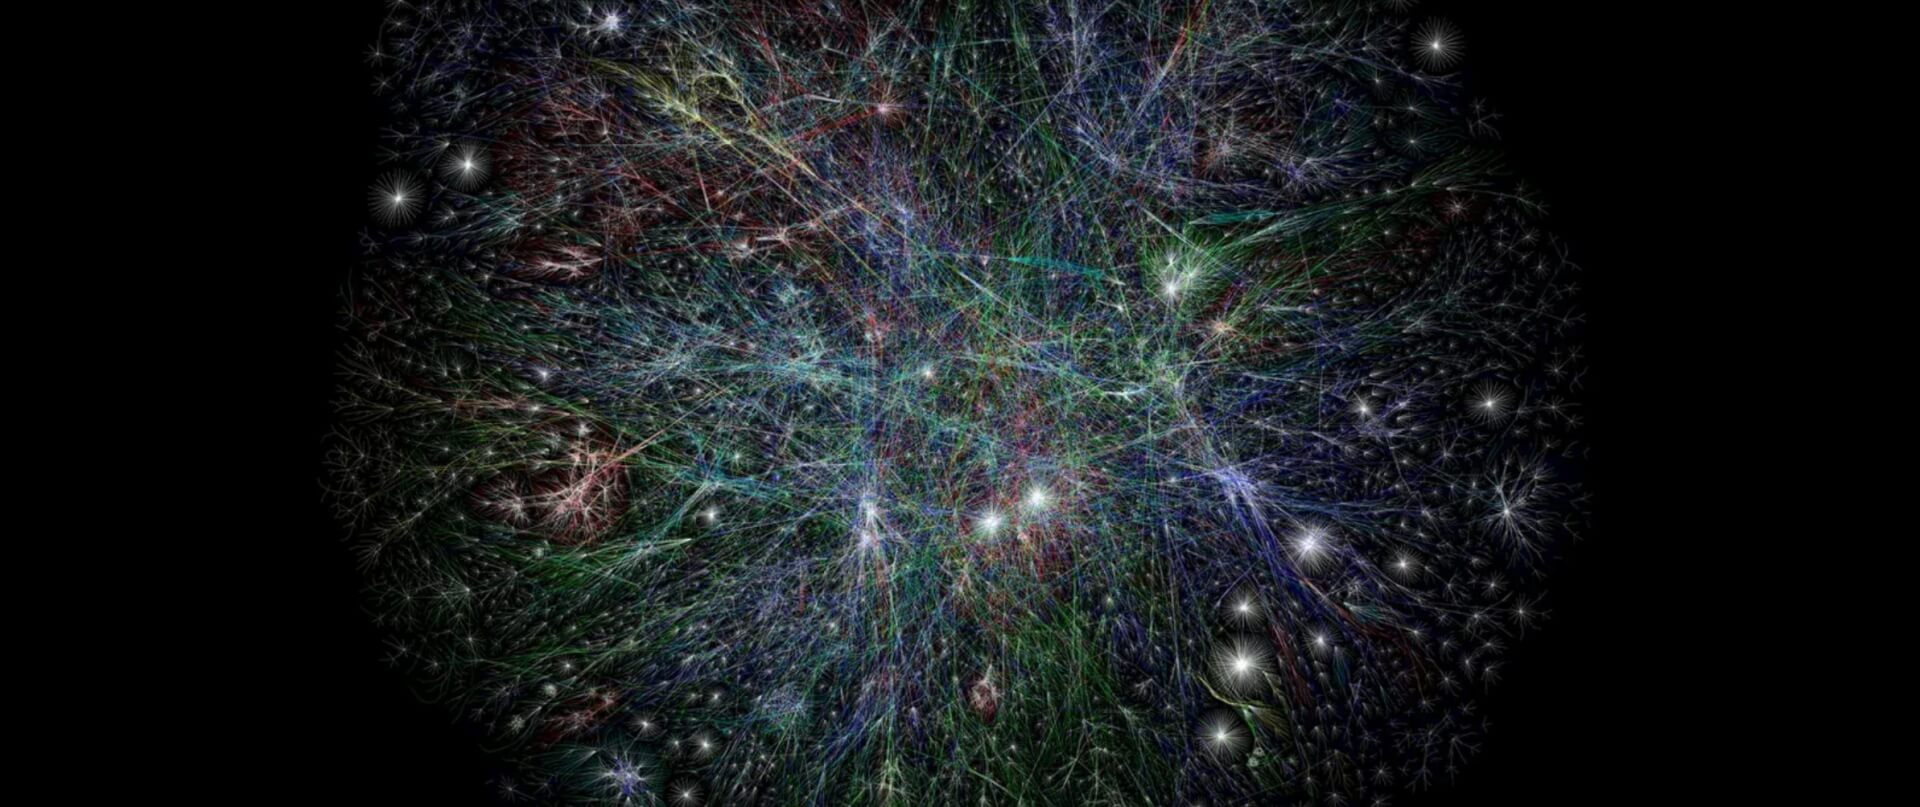
The maps looked like a nebula of countless, overlapping starbursts connected by branch-like lines that represent the internet at a specific point in time.

Born out of Necessity – Representation of The Internet
“What you’re looking at is not a real world. You’re looking at a representation of this different dimension, so to speak,” says Lyon. “The Internet is really big, very connected, and extremely complex. It’s this whole world you can’t see. That’s the fun part of visualizing it.”
The growth of the Internet from 1997 to 2021.
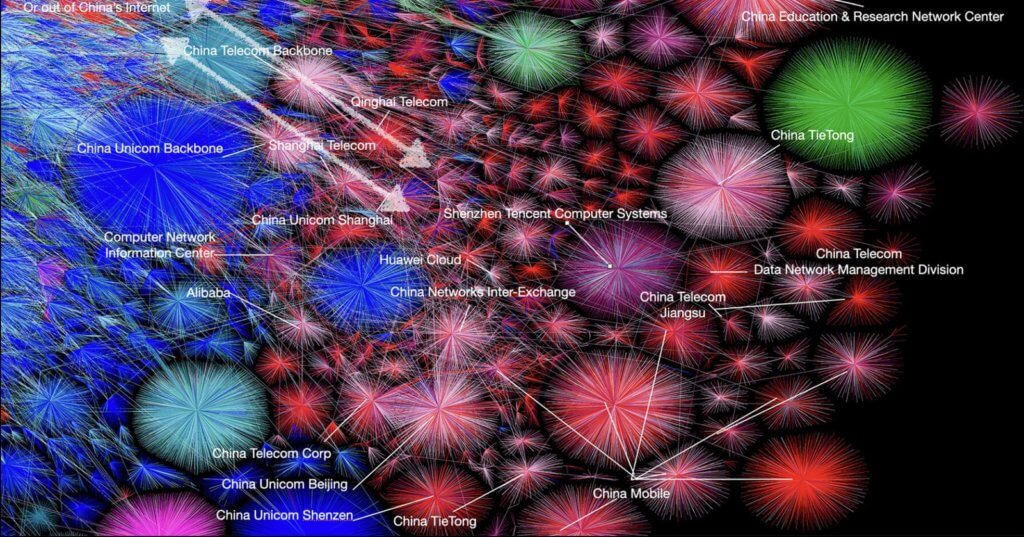
For instance, in a 2003 print screen of such a map from the project, the different colored lines indicate the location of the IP space, while each line shows the communication between two internet protocol (IP) addresses and the length of the lines denotes the delay between the two nodes. Red lines, for example, represent Asia and the Pacific Islands, while the dark blue ones correspond to North America.
Internet Between 1997 – 2021.
The image itself “was based on a technology called ‘traceroute,’” that displays possible routes and measures the transit delays of packets across an Internet Protocol network. “It would be like driving each road in the world systematically and then drawing that out,” explains Lyon.
“When I look at it, each one of those little squiggles and wiggles is human beings doing something,” Lyon says. “People actually using the network, building the network, literally going across oceans and mountains with fiber optic cables and digging ditches. All of that work is reflected in one snapshot. But some countries are not actually very connected and that enables control.”
The Opthe Project is as much art as it is research and documentation.
However, a 2010 exhibit of the original Opte viewable at the Museum of Modern Art (MoMA) in New York and in an edition of Discover Magazine, used Border Gateway Protocol (BGP) as data points instead of traceroutes, in order to create a more accurate view of the internet. More recent maps even show BGP route leaks, which are incidents that involve “the propagation of routing announcement(s) beyond their intended scope” according to The Internet Engineering Task Force’s (IETF) definition, or more exactly, events where the data that was meant to go on a certain path was accidentally or maliciously redirected to other parts of the network.
The Opte Project Can Also Teach Humanity
What’s even more interesting is that the visualizations can also detect the effects of natural disasters and wars, since these are mostly always accompanied by large-scale internet service outages. Such incidents include this year’s Myanmar internet disruptions that were ordered by the military after people mobilized for protests amid reports of uprisings and the detention of political leaders or Iran’s Internet blackout from 2019. An event which was ordered by the Supreme National Security Council and imposed by the Ministry of Information and Communications Technology (Ministry of ICT) following “Bloody November” a series of nationwide civil protests caused by a staggering 50%–200% increase in fuel prices. Lyon confirmed that he is collecting more data in order to create a more accurate picture of any major recent events.
Ever since its conception, the Opte Project has gathered worldwide recognition and has been featured by Time, Cornell University, New Scientist, and Kaspersky Lab, while several of its maps are displayed in art galleries and exhibits such as The Museum of Modern Art and the Museum of Science. Opte’s creator, Lyon has even been called a hero by the American Organization the National Public Radio for his contributions in tracking down Russian extortion groups responsible for denial of service attacks (DoS attacks), cyber-attacks that shut down a computer or a network by disrupting services of a host connected to the Internet. His work has even been featured in the cyber-thriller “Fatal System Error” while his help and the information he provided to multiple law enforcement groups led to the capture of three Russian men responsible for extorting money from banks, Internet casinos, and other web-based businesses.
Follow TechTheLead on Google News to get the news first.